I do home recording as a hobby, and this year I finally got around to buying some studio monitors with some decent low-end. I’ve been doing home recording since the mid-1990s, so this was long over due. Except for the first few years of this endeavor, I had decent rooms to record in with some purpose built and actually quite lucky features in the rooms that make recording and mixing enjoyable.
In this post, I’m going to walk you through the process I followed to set up the monitors, then ‘pink’ the room with pink noise to see what the room response was at my listening position, and then how I flattened out the room a little bit with EQ. Along the way, I’ll show you some of the cool features I added to this room for usefulness as a home studio tracking and mixing room.
There’s a few concepts that are essential to understand to take this on in your home studio. The first is that of ‘pink’ noise. Pink noise is a random noise that has equal energy per octave band. Since I have a 31 x 1/3 octave band EQ in my rack between my audio interface and my monitors, I’m going to use 1/3 octave analysis to check how my monitors respond in my room to pink noise. Pink noise sounds quite a bit like tuning into static on the radio – for those of you that still have a way to do that!
I won’t steer you to the wikipedia article on pink noise – I’ve studied acoustics as part of my profession as an engineer, and I’ll say that the wikipedia article is very ‘scholarly’. Instead of pointing you there, this article at Sweetwater is a nice and tidy description of why pink noise has significance in eq setting.
So, my first step in equalizing my monitors in my room was to go get some pink noise. I was specifically looking for uncorrelated pink noise as a stereo .wav file. Why ‘uncorrelated’? What this means, for all practical purposes, is the pink noise randomness in the left channel, is not time correlated with the pink noise randomness in the right speaker. If the left and right channels were correlated, then I could get some potential comb filtering stuff going on with reflections in the room as I set the eq. Comb filtering is a nemesis of setting up speakers for monitoring resulting from reflections of a wave arriving slightly time delayed at the ear, compared to the direct sound – as the path is just ever so slightly longer reflected than direct. This has a phase cancellation result that is audibly strange and not suitable for mixing.
I found the uncorrelated pink noise in a nice package of test signals at Dynaudio. Read their page, then go to the bottom and hit the .zip download link. This .zip file has all kinds of useful test .wav files.
With the pink noise in hand, time to turn attention to speaker placement. The monitors that I purchased recommended a 60 degree toe-in as a starting point as well as experimenting with the lateral distance between the speakers. I placed the monitors at the edges of my desk. To set the toe-in, I printed off a 30/60/90 degree triangle and cut out the triangle shape. Here’s a couple of photos of using the triangle with the back edge of the desk as a reference; first setting toe-in of the right, then the left monitor. The view is looking down on the desk and aligning the side of the monitor with the 60 degree angle formed by the back of the desk and the monitor. Now, some of you that have some big rooms, you immediately notice my violating a practice of monitor placement – and that is trying to keep them away from the wall behind them. This room is only 11′ from the blue wall you see to the wall behind the listening position. I wouldn’t mind a larger room, but it isn’t going to happen!


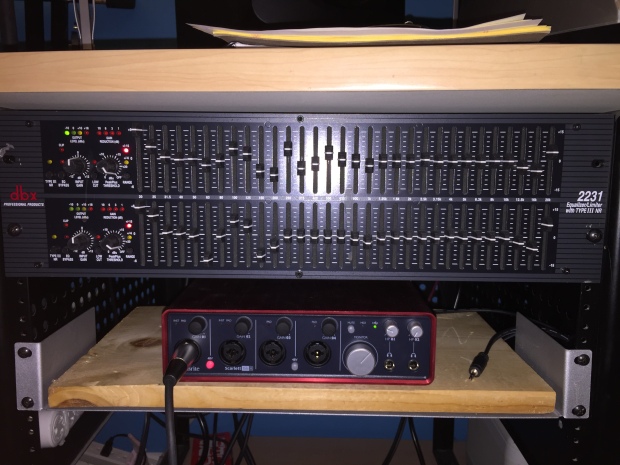
The monitors do have a selectable gain shelving filter switch on the back and I ended up leaving in the as shipped position for now.
I also see lots of fancy monitor isolation out there on the market. Most of the isolators sold for monitors talk about isolating the low frequencies from the desk. You can do this quite expensively (one set of isolators I found actually cost more than I paid for the monitors themselves). Or you can take a home-recording-on-the-cheap approach like I did – which was look for some alternative isolation. I used a highly scientific method to determine the isolation effectiveness of my isolators – I played the same song, at the same level, directly on the desk and then on the isolators and felt for the amount of low frequency vibration that could be felt on the desktop in both situations. I can say that my isolators are VERY effective at reducing the low frequency vibration transferred to the desktop. I bought them at Harbor Freight Tools. Yes, the place that smells of cheap vinyl-based rubber. In fact, the isolators I bought could be responsible for a great deal of that smell at Harbor Freight. What did I use? I bought some 10″ diameter pneumatic wheels and removed the center steel wheel portions – so I have just the tire with inner tube inserted. Here’s some shots before and after removing the center steel portion. Total outlay for these: $8.


For now, I have placed the monitors on a piece of thick paper towel on top of the tires – ok, time to be honest, they are tires, but they are really pretty great isolators. I will eventually replace the paper towel with some nice looking fabric.
Now back to the pink noise.
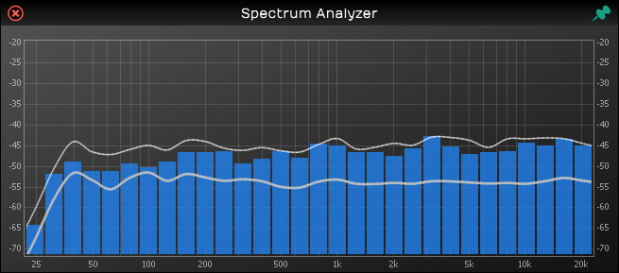
I loaded the pink noise .wav file into a track in my DAW (I use Tracktion 6 – which is completely and entirely free to use, no nag screens, no limitation to use just it’s built in effects, etc. ) and put an instance of the very excellent Spectrum Analyzer VST from Seven Phases on the output of the track. This plugin uses actual digital filter implementation of the 1/3 octaves, instead of the much more common FFT method. There are several technical reasons why this is a superior way to measure 1/3 octave levels which I could go into but I would bore those of you still reading this very long post – so I won’t do that but just say that a proper Real Time Analyzer (RTA) almost all use digital filter method over FFT for 1/3 octave analysis. This plugin has very simple controls and provides real-time display of the 1/3 octave level (blue bars), a curve representing a delay-faded peak value (top curve) and most importantly, an average of the 1/3 octave level represented by the bottom curve. Here is the output of the analysis just operating on the .wav file loaded into the first track on my DAW.
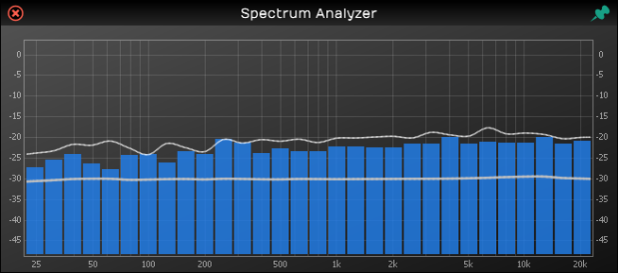
As you can see by the average line (the one below the tops of the blue bars) this pink noise file is danged close to a perfect pink noise file with the very flat average line.
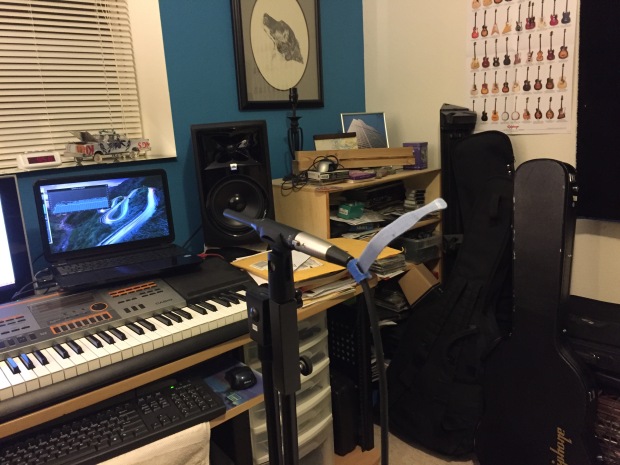
Next is to set up the analysis microphone (I borrowed a dbx measurement mic from my church) at my listening position, and make sure that the signal being recorded by the mic is only being sent to the analysis plugin and not feeding back out to my speakers.
This is a picture of the mic at the listening position (have it set pretty much at ear level, at the center of where my head would be in the listening position).
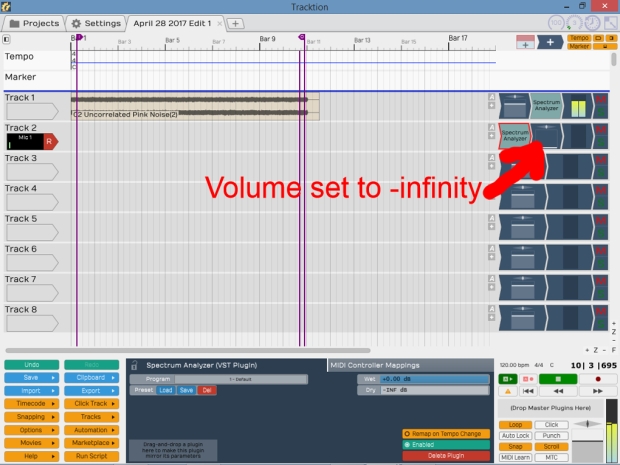
And here is the screenshot of my DAW setup – pink noise file on looped playback in top track, and the microphone set to gain so that I was getting a solid green but no amber/red peaks on that channel, and noting that the spectrum analysis is BEFORE my volume fader on that channel, which is set to -infinity.
Checking to see what the mic was seeing with the spectrum analysis without applying any EQ, here is what the pink noise played through my monitors, and picked up at the listening position looked like.
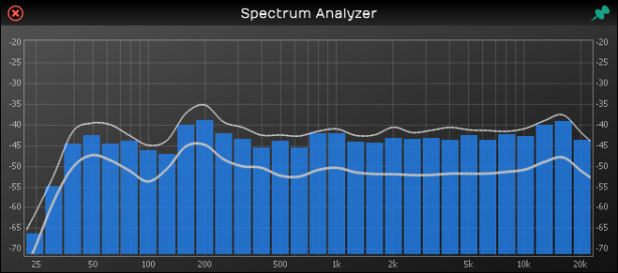
This was a bit flatter than I expected, but still, not the table flat response of the pure pink noise file itself. Notice the fairly flat response across the 1600-8000 Hz range.
So, now the process began of trying to use my graphic EQ to adjust for this non-flat response. I set the left and right channels independently of each other. I first panned the playback hard left and set the left graphic eq sliders until I could not make it any flatter compared to that relatively flat section from about 1600 Hz to 8000 Hz. Then I repeated that for the right side; first panning hard right and setting the graphic eq sliders, again shooting for the response to match the level in the 1600-8000 Hz range.
This is about as good as I could get in the time I allowed myself, which was an hour or so (I can really nerd out on this, but I want to get to using these monitors for mixing, not just playing with 1/3 octave analysis and pink noise).
If I spent more time with this, using some of the other signal files in the zip file from Dynaudio, which have single band pink noise, I could probably dial this in a little closer than what I achieved here. But listening to some pink noise itself, and some of my favorite recordings for checking listening systems, I am really happy with what I have right now. For those interested, here’s a photo of my EQ settings I used to achieve the above.
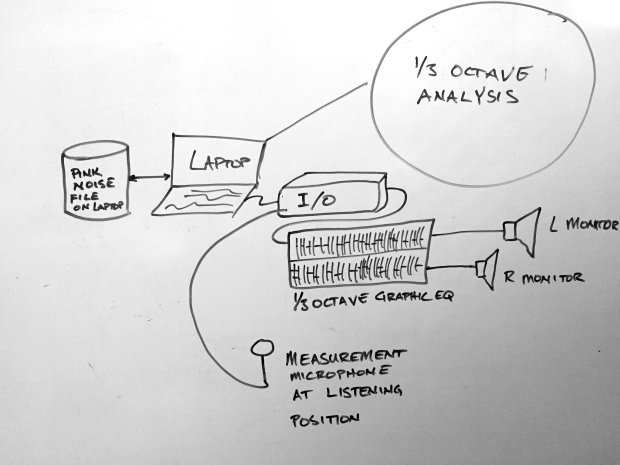
For those of you more visually inclined, here is a graphic I drew on a whiteboard which has the basic elements of the signal setup to ‘pink’ a room using a computer, pink noise file, 1/3 octave analysis plugin, audio interface, graphic eq, and a measurement microphone.
Now if you are still with me – and I don’t necessarily expect that you are – let’s get into some slightly nerdy acoustic treatments and tools that I’ve gotten lucky with and that are intentionally put in the room.
First, is the only piece of custom furniture my wife and I have ever had made – The Murphy bed in this room. When it’s folded down, it’s a bed for guests. When it’s folded up, I get lots of floor space for guitars and basses and whatnot on stands, and it becomes a pretty decent diffusor of low frequency. Oh, when it’s folded down, it’s quite a bit of mid to low frequency absorption.


In the photos of the Murphy bed, you see what looks like a green horizontal stripe. That is actually a drywall enclosure of the main I-beam that holds up the house. What it provides is a break-up of that whole corner in the room, as well as a place to hang my flutter controller – the multi colored stripey wall hanging. I built that out of 1″x2″ material and the stripey thing is actually a throw-rug from IKEA, which I liked for the colors (had the paint matched). Here you can see it a little closer.
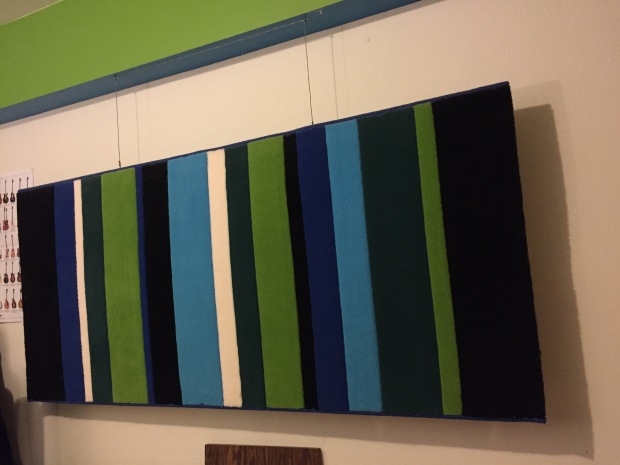
The surface of the rug is about 5″ from the wall. The backside of the rug is what I would call open weave. There’s no thick glue or rubber backing. I have also started to staple open cell foam to the frame work on the back side of it. Here’s a shot of the back side.
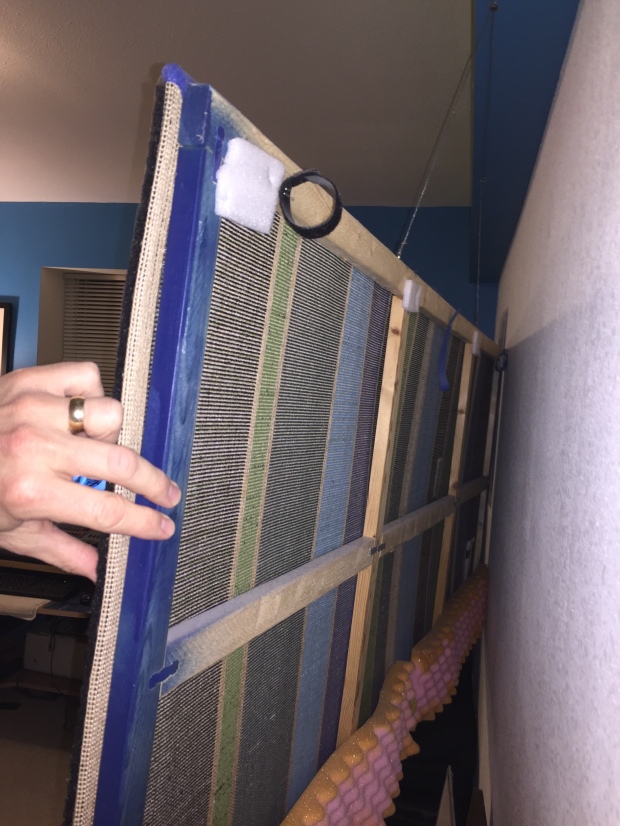
The velcro cable ties you see stapled held a rope light at one time, but it didn’t look as cool as I hoped so I pulled that out. Now, why hang this out away from the wall instead of mount it directly to the wall? Well, by putting out a distance, it actually can achieve more absorption than if it was hard onto the wall. The sound that makes it through the rug and hits the wall bounces back primarily to the rug; losing some energy in the double path and gets cut down even more as some of it makes its way from teh back of the rug to the front. The rest bounces back to he wall, and loses more energy as it then bounces back to the rug, some more gets absorbed, and so on. This thing is REALLY effective at killing the flutter echos in the room. There’s absolutely no perceivable ‘ping’ in the room when you clap your hands in the room.
On to the next lucky thing. This is a room that is in the basement of the house. Remember we talked about that I-beam above? Well, that I-beam also divides the basement from an HVAC routing standpoint. This room has no forced air inlets or cold-air returns. I didn’t design it this way, it was the way the house was set up by the prior owners. Lucky break. In our last house, I had a room built in the basement with all kinds of work (double wall construction with different thicknesses of drywall for each wall), heavy solid wooden door with gasket sealing, etc.) but I also had HVAC routing in/out of the room, and that flanking path almost defeated all of the work on isolation and mass damping I put into the room to begin with. This is a much better room, with no intentional design elements other than what I have added. Only issue – it can get kind of cold in the winter. Space heater to the rescue. Remains nice and cool in the summer.
Next lucky item: the closet. This room has a double-wide closet with sliding doors, and I can open up one of the sliding doors to serve as a back-wall for a ‘vocal booth’ of sorts. It’s stuffed with our winter coats and extra pillows, comforters, etc.
I have built a standing ‘wall’ from more 1″x2″ and 2″x2″ material, stapled another one of those IKEA rugs on the back side, and on the front side, I have a bunch of 3″ acoustic wedge foam scraps that I scavenged from the scrap heap at my old employer where I worked in the noise & vibration lab glued to a piece of paneling.
I set this at an angle to the open closet door, and do all my mic recordings in that little triangular space. Really quite dead there.


So there you have it. If you have any questions or comments, hit my contact link and I’ll try to respond in a reasonable amount of time.
